
5 Steps to Take Before You Ever Make an Options Trade

Options trading can be a tricky and intimidating investment strategy. There are many choices to make. The "win" rate is generally relatively low, so having a systematic way to evaluate options is key to your success. While no system is perfect, here are five essential metrics to consider so that you can increase the odds of winning the next time you enter an options trade.
Please note that these steps should come after you have done your research and picked a stock or index to trade. These steps will help raise your probability of winning even more.
#1) Evaluate the Delta
One important factor when considering an option is the "delta." Delta is a ratio is also referred to sometimes as the hedge ratio, which compares price change in a derivative or option with the change in the price of an underlying asset.
Delta is one of four measures that traders use for analyzing risk (gamma, theta, and vega are the others). One way that options traders use the delta to indicate how many options contracts would be needed to hedge an underlying short or long position.
Another way to use the delta is to determine the time and relative price range on options you consider buying. You want to know whether or not the delta is in a reasonable range with a probability that is in your favor. Call delta values range from 0 to 1.00 (or 0 to 100), and put delta values range between 0 and -1.00 (or they could be 0 to -100). Although not mathematically correct, you can look at deltas as the probability they will finish in the money. So a short call with a delta of 42 would have approximately a 42% of finishing in the money.
For example, consider the following scenarios: when selling a put. A 30 delta is an excellent area to sell as it's far enough out of the money and putting probability in your favor while still getting enough premium to make it worth it. We advocate that for selling options, a 30 delta is the sweet spot, if you will. You can be slightly more aggressive or conservative, but that is where we recommend starting.
For buying options, a "soft" rule for buying calls might be:
#2) Consider the Volatility
Volatility, when talking about options markets, is referring to fluctuations in underlying asset market prices. Vol, as it is known, is a metric that considers speed and movement for underlying asset prices. Being aware of volatility informs investors to understand option price behavior better.
Two common types of volatility affect option prices. Implied volatility is specific to options and is essentially a prediction made by participants in the market of the extent to which future moves will occur in underlying securities. Implied volatility essentially boils down to a real-time estimation of the asset's price as it currently trades. Ultimately this provides a predicted volatility for an option's underlying asset over the option's entire lifespan, using relevant formulas designed to measure market expectations.
During downtrends in options markets, implied volatility generally increases. Conversely, when there are market uptrends, implied volatility usually falls. Higher levels of implied volatility indicate future expectations of more significant stock price movement.
Options are also affected by historical volatility, which is also known as realized volatility. HV, as it is referred to, is a measure of the speed at which underlying asset prices change over a given period. Historical volatility is typically calculated annually but is constantly changing. It could also be calculated daily or even for shorter time frames. Generally, higher historical volatility percentages translate to higher option values.
💰 Option Selling
When considering selling options, check if the implied volatility is over historical. Implied should be trading over historical so you can capture the volatility risk premium, as volatility is mean-reverting.
🛒 Option Buying
For buying options, the reverse is true. You want to buy cheap volatility and want historical to be over implied.
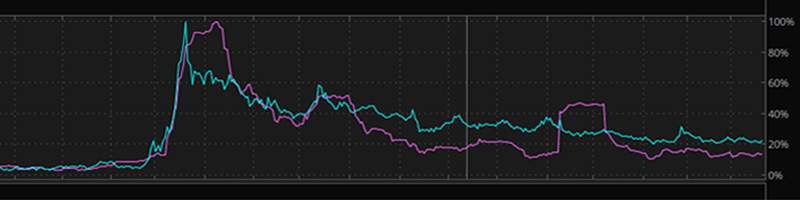
See the chart above: blue is implied, and purple is historical volatility.
#3) Look at the Implied Volatility Percentile
Next, consider the implied volatility percentile. Following is one example from ThinkorSwim Desktop that illustrates how you might see this metric listed:
- 52 week IV High: 1.678
- 52 week IV Low: 0.213
- Current IV Percentile: 22%
- 52 week HV High: 2.255
- 52 week HV Low: 0.25
- Current HV Percentile: 9%
- Implied Volatility: 53.93%
- VWAP: 97.108
Volatility percentile ranges give you essential clues regarding the types of trades you might want to consider. Here are volatility percentile ranges, along with suggested courses of action for each:
70 - 100th Percentile
With high implied volatility, you want to generally be using option selling strategies exclusively. High vol would be a great time to use iron butterflies, straddles, and strangles. Credit spreads (put and call spreads), along with iron condors, would still be applicable here.
50 - 70th Percentile
With a somewhat high implied volatility, you want to look at being a seller of options. Therefore using risk-defined strategies such as credit spreads (put and call spreads) and iron condors would be advised.
0 - 50th Percentile
With low implied volatility environments, you should typically avoid option selling and focus more on net-buying strategies, including debit spreads (put and call spreads). Calendar and vertical spreads would generally work well here.
#4) Check Earnings and Events
An often overlooked factor in options trading is the potential impact of the underlying asset's earnings and event schedule. You should most definitely be aware of any earnings, or other notable events are coming up in the relevant future time frame. Specifically, before selling an option, make sure the expiry is not beyond the earnings date.
You should also monitor for significant events such as big conferences or product launch announcements, which could substantially and rapidly impact the pricing structure. Now, if you are a buyer of options, you may want those potential catalysts. Maybe you are expecting solid earnings or a new announcement that will push the stock higher.
#5) What is the RSI?
The relative strength index (RSI) is an indicator measuring momentum. RSI compares the magnitude of recent gains and losses over a specific period. The goal is to measure the speed and change of a security's price movements and determine where there are overbought and oversold conditions. RSI values range between 0 and100; values above 70 are generally considered an indicator of overbought levels, while values below 30 indicate oversold levels.
RSI works particularly well for options on individual stocks. In fact, RSI is a much better tool to use for stock options than indexes, given that stocks demonstrate overbought/oversold conditions more frequently than indexes. Specifically, options on highly liquid, high-beta stocks give you the best chances for successful shortterm trading based on RSI.
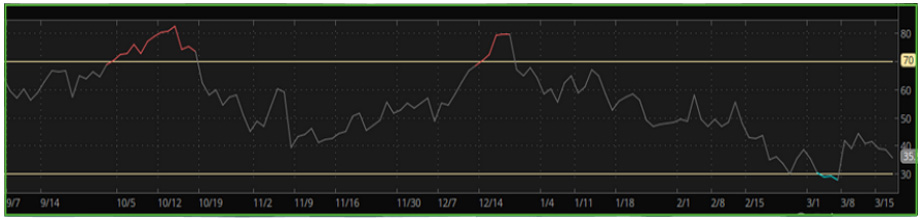
Armed with the knowledge of RSI values, it is better to sell a call option/call spread or buy a put/put spread when RSI is at or close to 70. Conversely, it is better to sell a put option/put spread or buy a call/call spread when RSI is at or close to 30.
See the chart below: red indicates the stock is a sell, and blue indicates the stock is a buy. From here, you can use the appropriate option strategy.
Summary
If a security meets all five of these criteria, and you have done your research before these steps, it may be a great trade. Many variables are in your favor, and all you can ask for is to increase your probabilities of success. Take the following examples to consider how this system might work for you.
Option XYZ
- DELTA: 50
- IMPLIED VOLATILITY: Historical over Implied
- IMPLIED VOLATILITY PERCENTILE: 35th
- EARNINGS: Two Weeks out
- RSI: 27
Option ABC
- DELTA: 50
- IMPLIED VOLATILITY: Historical over Implied
- IMPLIED VOLATILITY PERCENTILE: 80th
- EARNINGS: Two Weeks out
- RSI: 65
You can see that Option XYZ and Option ABC are similar in terms of these five metrics. Consider XYZ's delta of 50, along with its 35th percentile implied volatility percentile, a short-term earnings schedule, and an RSI of 27. These facts would point to a short-term options buying strategy using our system. All of the metrics line up to tell you that this is a green light.
Second, consider Option ABC's metrics. They are similar except for an 80% implied volatility percentile and the RSI. These metrics should give you pause on this trade. In comparison, the other information might lead us to take on a buying strategy similar to XYZ. The higher implied volatility percentile and the RSI conflicts, as it flashes a sell signal. You might want to avoid this trade.
Let's look at another example.
Option XYZ
- DELTA: 30
- IMPLIED VOLATILITY: Implied over Historical
- IMPLIED VOLATILITY PERCENTILE: 89th
- EARNINGS: Three Months Out
- RSI: 71
Option ABC
- DELTA: 30
- IMPLIED VOLATILITY: Historical over Implied
- IMPLIED VOLATILITY PERCENTILE: 18th
- EARNINGS: Three Months Out
- RSI: 71
You can see that Option XYZ and Option ABC are similar in terms of these five metrics. Consider XYZ's delta of 30, along with its 89th percentile implied volatility percentile, a long-term earnings schedule, and an RSI of 71. These facts would point to a short-term options selling strategy using our system. All of the metrics line up to tell you that this is a green light.
Second, consider Option ABC's metrics. They are similar except for historical trading over implied and the implied volatility percentile. These metrics should give you pause on this trade. In comparison, the other information might lead us to take on a selling strategy similar to XYZ. The historical trading over implied and lower implied volatility percentile conflicts, as it flashes a buy signal. You might want to avoid this trade.
After you have done your research and picked a security to trade, it is best to be systematic in your options trading. Suppose you have defined parameters guiding your trades. In that case, it is easier to make trading decisions. It also permits you to evaluate the underlying strategy effectively. Consider the delta, implied volatility, implied volatility percentile, earnings schedule, and RSI next time you trade.
Stay Connected!
Join our mailing list to get notified of all new blog posts, and receive the latest news and updates from our team.
