
Covered Call Calculator: Know Your Return Before You Trade
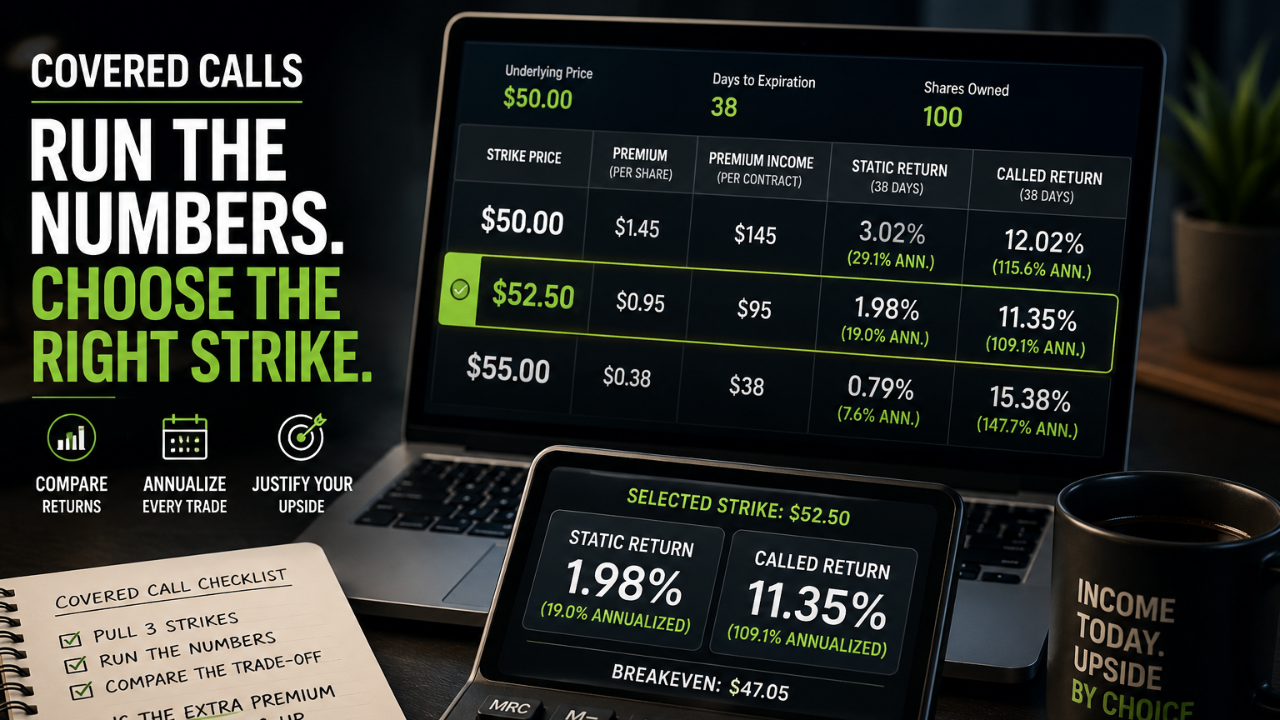
Most covered call sellers pick a strike because the premium "looks good," then find out weeks later that the trade capped their upside for a return barely better than holding cash. A covered call is worth doing only when the numbers justify the ceiling you are accepting, and you cannot know that until you have run three of them: your static return, your called return, and both annualized.
Use the calculator below to run those numbers on any trade you are considering. Then read on for how each figure is built, because the calculator is only useful if you know which number matters for the trade you are actually making.
Key Takeaways
✅ Static return is what you earn if the stock does nothing. Called return is what you earn if the shares get assigned at the strike.
✅ Always annualize. A 1.8% premium over 30 days and a 1.8% premium over 90 days are completely different trades.
✅ Your breakeven is your stock cost basis minus the premium collected. That is the only downside protection a covered call gives you.
✅ If the called return is barely above the static return, you are giving away upside for almost nothing. Pick a higher strike.
✅ Annualized returns assume you can repeat the trade all year. You usually cannot, so treat them as a comparison tool, not a forecast.
The Five Numbers a Covered Call Calculator Gives You
Every covered call has the same moving parts: the price you paid for the stock, the strike you sold, the premium you collected, and the time left until expiration. Those four inputs produce five outputs that tell you whether the trade is worth making.
1. Premium income
The cash that hits your account the moment you sell. One contract covers 100 shares, so a premium quoted at $1.45 pays you $145 per contract before commissions. This is yours to keep no matter what the stock does afterward.
2. Static return
What you earn if the stock sits exactly where it is and the call expires worthless. It is the premium divided by your cost basis in the shares:
This is your baseline. It is the return you are being paid for agreeing to cap your upside.
3. Called return
What you earn if the stock finishes above the strike and your shares are assigned. Now you collect the premium and the capital gain up to the strike:
If you sold an in-the-money call, that middle term is negative and your called return can be lower than your static return. That is not automatically wrong, but you should know you are doing it.
4. Breakeven
Your cost basis minus the premium. Below that price you are losing money on the position as a whole. The premium cushions a small decline and nothing more, which is the single most misunderstood part of the strategy. The Options Industry Council is blunt about this: a covered call is not a hedge, it is an income trade on a position you already carry the full downside of.
5. Annualized return
The number that makes trades comparable. Take the period return, divide by days to expiration, multiply by 365:
Without this step you cannot tell a good 45-day trade from a mediocre 14-day one.
A Worked Example: Two Strikes on the Same Stock
Say you own 100 shares of a stock you bought at $48.00, and it is now trading at $50.00. Two calls expire in 38 days:
- The $52.50 call pays $0.95
- The $55.00 call pays $0.38
Run both through the formulas above and the trade-off becomes obvious.
The $52.50 call at $0.95
⚡ Premium income: $95
⚡ Static return: 0.95 ÷ 48.00 = 1.98% (annualized 19.0%)
⚡ Called return: (0.95 + 52.50 - 48.00) ÷ 48.00 = 11.35% (annualized 109.1%)
⚡ Breakeven: $47.05
The $55.00 call at $0.38
⚡ Premium income: $38
⚡ Static return: 0.38 ÷ 48.00 = 0.79% (annualized 7.6%)
⚡ Called return: (0.38 + 55.00 - 48.00) ÷ 48.00 = 15.38% (annualized 147.7%)
⚡ Breakeven: $47.62
The $52.50 call pays you two and a half times more income to wait. The $55.00 call pays you far less now but leaves $2.50 more room to run before your shares get taken.
Neither is correct in the abstract. The question the calculator forces you to answer is: is that extra $57 of premium worth giving up $2.50 per share of upside? On a stock you think is going nowhere for six weeks, yes. On a stock about to report earnings, almost certainly not.
The Check I Run Before Every Covered Call I Sell
I have taught this strategy to enough beginners to know exactly where the money leaks, and it is almost never in the entry. It is in the strike nobody ran the numbers on. So before I sell any call, I run the same three-step check, and it takes under two minutes.
1️⃣ I pull three strikes, not one. The strike just above my cost basis, the next one out, and one further still. Same expiration for all three. Looking at a single strike tells you nothing, because you have nothing to compare it against.
2️⃣ I annualize the static return on all three and throw out anything under roughly 12%. That is my personal floor for accepting a ceiling on a stock I like. Yours may be different, but you need a number, decided before you look at the chain rather than after.
3️⃣ I check the gap between static and called. If assignment pays me barely more than the stock going nowhere, the strike is too tight and I move up. If the gap is wide, I am being paid properly for the upside I am handing over.
The step most people skip is the third one, and it is the one that decides whether the trade was worth making. A premium can look generous in dollars and still be a poor trade once you see what it costs you in headroom.
The other habit worth building: I write the expiration date and my exit rule down before I place the order. Not after. Once the position is on and the stock is moving, every number in this article starts looking negotiable, and that is exactly when traders talk themselves into holding a call they should have rolled.
How to Read the Gap Between Static and Called Return
The relationship between those two numbers is the fastest quality check on a covered call.
✅ Called return much higher than static: you sold an out-of-the-money call. You get paid either way, and assignment is the good outcome. This is the standard income setup.
✅ Called return close to static: your strike is barely above your cost basis. You are capping upside for almost no extra reward. Move the strike up or skip the trade.
✅ Called return below static: you sold an in-the-money call. You are trading upside for a bigger cushion. Legitimate on a stock you are lukewarm on, but understand that assignment is now the likely outcome.
This is the same logic that governs the real risks of covered calls, and it is why strike selection matters more than premium hunting.
Four Things the Calculator Will Not Tell You
Every covered call calculator, including this one, models a clean trade held to expiration. Reality adds friction:
⚡ Early assignment. If your call goes in the money near an ex-dividend date and its remaining time value is less than the dividend, expect to be assigned early. Cboe's education material covers the mechanics in detail. Check the dividend calendar before you sell.
⚡ Taxes. Premium is generally short-term gain, and assignment triggers a taxable sale of your shares. See the tax treatment of options trading, and note that qualified covered call rules can suspend your holding period if you sell a deep in-the-money strike.
⚡ Commissions and assignment fees. Small per trade, meaningful when you run the same position twelve times a year.
⚡ Repeatability. A 109% annualized return assumes you find that same trade every 38 days for a year. You will not. Use annualized figures to rank trades against each other, not to project income.
Using the Calculator to Compare, Not to Justify
The mistake most traders make is running the numbers on a trade they have already decided to take. Run three strikes side by side instead, on the same expiration, and let the spread between static and called return pick the strike for you.
If none of the three clears the return you need for the upside you are giving up, the correct answer is to sell no call at all that month. That is a real outcome and it is available every single time.
When the shares do get called away, the next question is whether to buy back in or sell a put to re-enter. That decision runs on the same arithmetic, and it is the full loop behind the wheel strategy. If the stock runs past your strike before expiration and you want to keep the shares, you will want a rule for rolling the call written down before it happens.
Frequently Asked Questions About Covered Call Returns
How do you calculate covered call return?
There are two returns. Static return is the premium divided by your stock purchase price, which is what you earn if the stock does not move. Called return is the premium plus the strike minus your purchase price, all divided by your purchase price, which is what you earn if the shares are assigned. Annualize both by dividing by days to expiration and multiplying by 365.
What is the breakeven on a covered call?
Your stock cost basis minus the premium you collected. If you bought at $48.00 and sold a call for $0.95, your breakeven is $47.05. Below that, the position is losing money overall. The premium is the only cushion a covered call provides.
What is a good annualized return on a covered call?
Most income-focused sellers target somewhere between 12% and 25% annualized on the static return, because that is the number they collect whether or not the stock moves. Anything dramatically higher usually means high implied volatility, which means the market expects a large move, which means more assignment or drawdown risk than the headline number suggests.
Should I use static return or called return to pick a strike?
Use both. Static return tells you what you are paid to wait, and called return tells you what you are paid if you are right about the ceiling. If the gap between them is small, the strike is too close to your cost basis and you are capping upside cheaply.
Does the calculator account for dividends?
Yes, there is an optional dividend field. Add any dividend you expect to receive before expiration and it will be included in both return figures. Be aware that an upcoming dividend also raises the chance of early assignment on an in-the-money call.
Four Calculation Mistakes That Flatter a Bad Trade
Most bad covered calls are not bad trades badly executed. They are ordinary trades measured wrongly, which makes them look better than they were.
⚡ Calculating breakeven from the current price instead of your cost basis. If you bought at $48.00 and the stock is now $50.00, your breakeven after a $0.95 premium is $47.05, not $49.05. Using the market price hides an existing loss and makes the cushion look twice as deep as it is.
⚡ Measuring return against the strike rather than your basis. Dividing the premium by the strike price is a common shortcut and it always flatters the trade, because the strike is the higher number. Your basis is what you have at risk, so your basis is the denominator.
⚡ Treating an annualized number as income. A 109% annualized return on a 38-day trade is not 109% a year. It is 11.35% once, expressed at an annual rate, and only if you are assigned. Annualizing is for ranking one trade against another. The moment you multiply it by your account balance to forecast income, it has stopped being useful.
⚡ Leaving out costs entirely. Commissions, assignment fees and short-term tax on the premium all come out of a number that was already the smaller of your two returns. On a $95 premium these are not rounding errors.
Every one of these mistakes moves the result in the same direction, which is the part worth noticing. Nobody miscalculates a covered call in a way that makes it look worse than it was.
Final Thoughts
A covered call calculator does not tell you whether to make a trade. It tells you exactly what you are being paid and exactly what you are giving up, which is the information most sellers skip past on their way to collecting a premium that turned out not to be worth the ceiling.
Run three strikes. Annualize everything. Take the trade only if the static return alone justifies the position, and treat assignment as a bonus rather than the plan.
How This Calculator Works, and What It Assumes
Transparency about the maths matters more than usual here, because a covered call calculator that hides its assumptions can make a mediocre trade look excellent.
⚡ All figures are per share unless labelled otherwise. Premium, strike and purchase price are per share; premium income and max profit are totals for the share count you enter.
⚡ Returns are calculated against your stock purchase price, not against the current market price or the margin requirement. This is the convention used by the Options Industry Council and it is the honest denominator, because your basis is what you actually have at risk.
⚡ Annualizing is linear, calculated as period return divided by days to expiration times 365. It does not compound, and it assumes the trade could be repeated, which is a comparison device rather than a projection.
⚡ Not modelled: commissions, assignment fees, taxes, early assignment, dividend capture by the call buyer, and any change in the stock before expiration. Each of these makes real results worse than the calculator shows, not better.
⚡ Dividends are treated as received in full if you enter one. If your shares are called away before the ex-dividend date, you will not receive it.
About the Author
Kevin Amell is the creator of Options Trading in 21 Days, a structured course that teaches self-directed retail traders to generate income by selling options rather than buying them. He also works with traders one to one through private coaching.
His focus is income-first options selling, covered calls, cash-secured puts, the wheel and credit spreads, taught with worked examples, explicit position sizing and written exit rules rather than hype. More at about Kevin Amell.
Disclosure and risk notice. This article and the calculator on it are educational and are not investment advice, nor a recommendation to buy or sell any security. Options carry substantial risk and are not suitable for every investor. A covered call caps your upside and provides only limited downside cushion, and you can lose money on the position. Figures shown are illustrative and do not represent the results of any actual trade. Read the OCC's Characteristics and Risks of Standardized Options before trading, and consider speaking with a licensed financial professional about your own circumstances.
Keep Learning
📘 How to Sell a Covered Call: A Comprehensive Guide
📘 Risks Associated With Covered Calls
📘 Options Break-Even Prices Explained
Strike selection is the skill this calculator supports, and it is exactly what we drill with real trades inside the Options Trading in 21 Days course.
Stay Connected!
Join our mailing list to get notified of all new blog posts, and receive the latest news and updates from our team.
