
How to Read an Options Chain (What I Check Before Every Trade)
An options chain is the list of every option contract available on a stock: calls on one side, puts on the other, strike prices down the middle, and a separate table for each expiration date. Each row shows the bid, the ask, volume, open interest, and usually the Greeks. Reading one is not about understanding every number. It is about knowing which four or five you need, finding them fast, and ignoring the rest.
I traded derivatives professionally for 22 years, and I still remember how the chain looked the first time I opened one: a wall of numbers with a piece of the puzzle everyone else seemed to have. The truth is the chain is simpler than it looks, and the way I teach it is the way I used it on a trading desk, working from the chain outward instead of trying to master the whole platform. This article walks through what the columns mean, how I go from an idea to a specific contract, how to enter the order without giving money away, and the mistakes that cost real traders real money.
Key Takeaways
✅ The chain is a menu: calls on one side, puts on the other, strikes in the middle, one table per expiration. You are choosing where (strike), when (expiration), and how (buy or sell).
✅ Bid is what buyers will pay, ask is what sellers want, and the spread between them is the cost of getting in and out. Tight spreads and healthy open interest mean a tradeable contract.
✅ Delta turns the chain into a probability map: a 30-delta option has roughly a 30% chance of finishing in the money.
✅ Never use a market order on an option. Start a limit order at the midpoint and walk it a nickel at a time. Do not chase the ask.
✅ Read the order back to yourself before you send it. Wrong strike, wrong expiration, wrong quantity, and wrong side are the mistakes that hurt, and every one of them is avoidable.
What the Columns on an Options Chain Mean
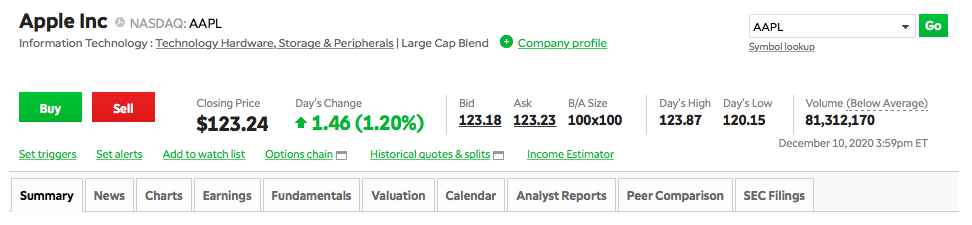
Here is a real chain, from a day when Apple closed at $123.24. Calls are on the left, puts on the right, the expiration is at the top next to the ticker, and the shaded rows are in the money.
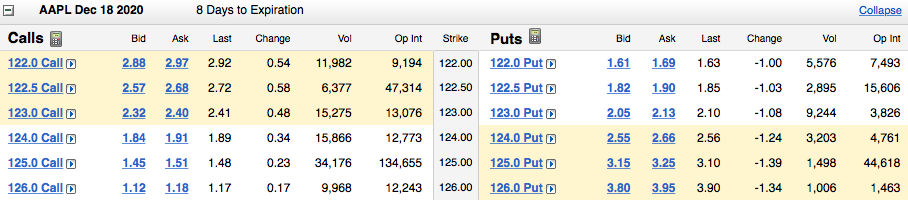
Platforms lay this out slightly differently, but the columns are the same everywhere:
🎯 Strike: the price the contract lets you buy (call) or sell (put) the stock at. Think of it as the level you believe the stock can reach, or the level you believe it will stay away from.
📅 Expiration: how much time you are giving the trade. Every expiration gets its own table.
💵 Bid: the best price someone is currently willing to pay for the contract. If you are selling, this is roughly what you get.
💵 Ask: the best price someone is currently willing to sell it for. If you are buying, this is roughly what you pay.
↔️ Spread: the difference between the two. Bid $1.00, ask $1.50, spread $0.50. This is the cost of doing business, and the wider it is, the more the trade has to move before you break even.
📊 Volume: contracts traded today. Works exactly like stock volume.
📊 Open interest: contracts currently outstanding. High open interest means plenty of other traders are in that strike, which usually means tight spreads and easy fills.
📐 Delta, gamma, theta, vega: the Greeks. Some chains show 0.30, some show 30; they mean the same thing. Delta is the one to learn first, because the market is using it to tell you the probability the option finishes in the money.
🌡️ Implied volatility: the market's forecast of how much the stock will move. When it is high relative to the stock's own history, options are expensive. When it is low, they are cheap. More in Implied Volatility Explained.
That is the whole vocabulary. The Options Industry Council has a free glossary if you want the formal definitions, but you do not need to memorize anything else to place a good trade.
Think of the Chain as a Menu
When students get overwhelmed, I tell them to stop reading the chain like a spreadsheet and start reading it like a menu. You are not trying to understand everything on it. You are choosing three things:
1️⃣ How: am I buying a call, buying a put, or selling one? That decides which side of the chain you look at. (If the four cells are still fuzzy, start with Call vs Put Options.)
2️⃣ When: which expiration table? That is how long you think the idea needs to play out.
3️⃣ Where: which strike row? That is the price level your view is built around.
Once you know those three, you go to that table, that side, that row, and read the bid and ask. Everything else on the screen is context you can grow into later.
How Do You Go From an Idea to a Contract?
This is the decision tree I ran on every trade: direction, plus time, plus a realistic price level, equals the contract. Here is what it sounds like in practice.
Direction. I think the stock is going up. So I am on the call side, either buying a call or selling a put below it.
Time. Why do I think it goes up, and when? If the reason is a six-to-twelve-month story, I need at least a six-month option and probably a year. If the reason is earnings in two weeks, I want roughly a 30-day option, close enough to the event that a big move accelerates its value. Mismatch these and you can be right on the stock and lose on the contract.
Price level. Be realistic. Stock at $10, I think a good report sends it up about 20%, so I am looking at $12. I buy the $10 calls so I capture that whole move; the $15 calls would be cheap because they are almost certainly not getting paid. Stock at $20 that I genuinely think doubles over a year, I might go out twelve months at a 30 to 40 delta and let it accelerate as the story plays out.
For a first trade, buying a call, keep it simple: 30 to 45 days out, at or slightly in the money, which lands around a 40 to 50 delta. If Apple is at $400, that is the $400 strike or one just below it. Cheap, far out-of-the-money calls are cheap because they rarely pay, and beginners confuse cheap with low risk every single day. The rest of the pre-trade checklist, including the earnings-date check, is in 5 Steps to Take Before You Ever Make an Options Trade.
Reading Delta as a Probability
The single most useful column after bid and ask is delta, because it is the market telling you the odds. A 30-delta put has roughly a 30% chance of finishing in the money, which means the seller of that put wins roughly 70% of the time. When I sell puts, I pick the strike from the delta column, not by guessing a dollar figure: usually 25 to 30 delta for puts, 30 delta for covered calls. When I buy calls, I want 40 to 50 delta so that a normal move actually shows up in the price of the contract.
There is one more thing the chain will tell you if you know where to look. Add the at-the-money call and the at-the-money put in the first expiration after an earnings date, and that straddle price is the move the market has already priced in. If the straddle costs $7.50 on a $100 stock, the market expects roughly a 7.5% move. You have to beat that number, not just be right on direction. I explain why that matters so much in IV Crush: Why Options Lose Value After Earnings.
Which Expiration Should You Choose?
The number of expirations depends on how heavily the stock trades. A name like Apple or SPY has weeklies and even multiple expirations inside a week; a thinly traded small cap may only offer monthlies.
📅 Monthly: the third Friday of each month. Every optionable stock has these, and it is where I do most of my income trading, around 30 days out.
📅 Weekly: every Friday on liquid names, typically listed a couple of months forward. Useful for tactical trades, dangerous for beginners because time decay is brutal.
📅 Quarterly: the third Friday of March, June, September and December, when stock options, index options and futures all expire together.
📅 LEAPS: long-dated options going out as far as three years, for slow theses that need runway. See How to Buy LEAP Options.
If an expiration Friday is a market holiday, the contract expires the Thursday before. Your platform will show the exact date; the point is that time is a choice you make on purpose, not something that happens to you. Too far out and a correct short-term call barely moves the option. Too close and the stock runs out of time to prove you right.
Placing the Order Without Giving Money Away
Here is the part that separates people who keep their edge from people who leak it on every fill. Options spreads are wider than stock spreads, and the market makers on the other side are algorithms. Trade accordingly.
✅ Never, ever use a market order. Not on options, and honestly not on stocks either. A market order pays the full ask, and now the trade has to make up the entire spread before you are back to even. Limit orders only, every time, no exceptions.
✅ Start at the midpoint and walk it. Bid $1.00, ask $1.50: I put my limit in at $1.25 and wait. If nothing happens in a minute or two, I bump it to $1.30, then $1.35, in nickel steps (some contracts trade in dime steps). It will fill. Sometimes it fills in the middle and you just saved $300 on execution alone.
✅ Do not chase the ask. You move to $1.45, the ask moves to $1.60. You move to $1.55, it moves to $1.75. The algorithm sees your order and steps ahead of it, hoping you keep raising. Leave the order at a fair price and it will usually come back to you. A minute after the chaser pays $1.70, the ask is back at $1.50.
✅ Treat a wide spread as a warning. A bid of $0.10 against an ask of $4.00 is a red flag. Use your platform's theoretical price instead of the midpoint and do not move more than a tick or two from it. If the spread is $2 wide, ask why, and whether the trade is worth it at all.
✅ Sell at the open, buy later. In the first minutes of the day the market is still working out prices and implied volatility runs hot, so options are briefly expensive. That is a fine time to sell premium and a poor time to buy it. If you are buying, wait 30 minutes and let it settle.
Tick sizes, for the curious: options under $3.00 generally quote in $0.05 increments and above $3.00 in $0.10, though the Cboe penny program lets many popular names trade in $0.01 and $0.05 steps. Your platform will only accept valid increments, so you will find out quickly. Platform choice matters here too; the chains, fill quality and order screens differ, and I compared the main ones in Top Options Trading Platforms.
Read It Back Before You Send It
Every platform has a preview or confirm screen. Turn it on and never turn it off. Then, before you hit send, read the order back to yourself, out loud if you can. I did this for 22 years and I still do it, because I have made six-figure mistakes on trading desks by grabbing the wrong line, and the worst feeling in this business is a loss that had nothing to do with your idea.
❓ Right side? I am bullish. Did I buy a call, or did I grab a put by mistake?
❓ Right expiration? I meant 90 days. Is this the 30-day table?
❓ Right strike? I meant the 55s. Did I click the 65s?
❓ Right quantity? One contract is 100 shares. Ten is 1,000. Did I type 10 when I meant 1?
❓ Right risk? Most platforms show max loss on the preview. If I expected $500 and it says $5,000, I forgot a leg or picked the wrong one. If I am selling, do I have the hedge on, and am I comfortable being on the hook for the stock?
Not every platform stops you from entering a "wrong" trade. Some will happily let you sell a naked call you did not mean to sell, and in a bad case your account can be frozen while it gets sorted out. Thirty seconds of reading it back is the cheapest insurance in trading.
The Four Ways to Trade Any Contract
When you click a row on the chain, the order ticket will ask what kind of trade this is. There are only four:
✅ Buy to open: you are purchasing a new option.
✅ Sell to close: you are selling an option you previously bought.
✅ Sell to open: you are writing a new option and collecting the premium.
✅ Buy to close: you are buying back an option you previously sold.
Mixing up "to open" and "to close" is one of the most common beginner errors, and it is one the preview screen will catch if you read it. Once the trade is on, the positions tab is where you live: it shows what you own, what you paid, and today's profit or loss, and it is the screen you check daily to decide whether to hold, take the gain, or roll.
Practice Until You Are Bored
Everything above is easier to learn by doing than by reading. Open a paper-trading account, pull up the chain on a stock you know, and place one trade: one call, 30 to 45 days out, at the money, limit order at the mid. Then watch it. Watch what happens when the stock moves, when it does not, and as the expiration gets closer and the value drifts even though the stock is flat. That is time decay, and you will understand it better from one paper trade than from any definition.
Stay in there until you are bored of it. Until you never hesitate about where the chain is, which table you need, or what "sell to open" means. That is not a few days. Give it a month at minimum, and I would love it if you gave it three, before a single dollar of your own money is on the line. The traders who last are the ones who made all their platform mistakes where they cost nothing.
Frequently Asked Questions About Options Chains
How do you read an options chain?
Pick your expiration table, then your side (calls or puts), then scan down the strikes. For the contract you want, check the bid and ask (what you can sell or buy for), the spread between them, volume and open interest (liquidity), and delta (the rough probability it finishes in the money). Those five numbers are enough to place a good trade.
What should beginners look at first on an options chain?
Liquidity. Choose strikes with tight bid-ask spreads and healthy open interest so you can enter and exit without giving money to slippage. Then delta, so you know the odds you are buying or selling. Ignore the rest of the columns until those two are second nature.
Should you use a market order or a limit order for options?
Always a limit order. Option spreads are wide and market makers are algorithms; a market order pays the full ask and forces the trade to earn back the entire spread. Start at the midpoint between bid and ask, walk it a nickel at a time if you must, and do not chase.
What does delta on an options chain tell you?
Two things: how much the option moves for a $1 move in the stock, and roughly the probability it expires in the money. A 30-delta put has about a 30% chance of finishing in the money, so its seller wins about 70% of the time. That is why income traders pick strikes by delta rather than by guessing a price.
Reading the chain is day-one material in the Options Trading in 21 Days course; days two through twenty-one turn it into a process.
About the Author
Kevin Amell traded derivatives professionally for 22 years, including running covered call portfolios that sold options on hundreds of stocks every month. He is the founder of Options Trading in 21 Days, a structured course that teaches self-directed retail traders to generate income by selling options rather than buying them, and he works with traders one to one through private coaching.
His focus is income-first options selling, covered calls, cash-secured puts, the wheel and credit spreads, taught with worked examples, explicit position sizing and written exit rules rather than hype. More at about Kevin Amell.
Last reviewed and updated by the author: September 14, 2026.
Disclosure and risk notice. This article is educational and is not investment advice or a recommendation to buy or sell any security. Options carry substantial risk and are not suitable for every investor. Figures shown are illustrative and do not represent the results of any actual trade. Read the OCC options disclosure document before trading.
Keep Learning
📘 How to Calculate Premiums in Options
📘 The 3 Best Technical Indicators for Options Trading
The chain is where every trade starts. Learn what to do with it inside the Options Trading in 21 Days course.
Stay Connected!
Join our mailing list to get notified of all new blog posts, and receive the latest news and updates from our team.
